
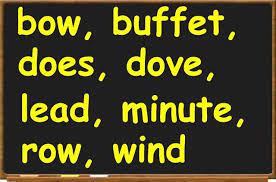
I love a good heteronym – words that are spelled identically but pronounced differently. The English language is full of them, and they make life fun. For instance, I use the Israeli app Waze when I have to drive anywhere out of town. One of its most oft-used phrases is, “object in road.” This is a helpful cue to a driver who would like to avoid hitting something, no matter what it might be. Except for a long time it pronounced the word as though it was describing a lawyer refuting some point while standing in the road – a funny picture to imagine (unless of course that lawyer is a Mock, then it is not funny).
I spend a lot of time looking at projections for my team, but also for your teams. I like to keep spreadsheets (though they pale in comparison to Ron’s incredibly detailed and colorful spreadsheets) of your rosters, and what the three main projections systems project your team to be. It is a fun project (see what I did there?) to undertake each off season.
But projection systems value different things, and so their output can vary quite greatly when it comes to our teams. For instance, ZIPS projects the Pears to finish with 96.5 wins, which would be a solid season, if not quite enough to win the EFL title. But get this – Steamer projects the same exact team to earn only 83.6 wins – difference of 12.9 wins! This is a dramatic difference, and one that should interest all of us and frighten one of us.
What I want to in this post is list for each team the high and low win total from each projection system (ZIPS, Steamer, and Pecota) and then highlight a player or two from each team who has the greatest discrepancy in WAR totals. Here’s hoping your players under contract don’t contract any illnesses/injuries (ouch, Eloy Jimenez is already out for most of the season – sorry, Ron!). I’ll try not to intimate too many intimate details about your team, so that what I present will feel more like a present than imprisonment.
Bellingham: The Cascades are projected to win 90.7 games by ZIPS (high), and 84.3 by Steamer (low), a difference of 6.4 games in total. PECOTA projects them win 86.7, so right in the middle. Each of these win totals puts them in the bottom half of the league in terms of wins. On the offensive side there isn’t anything too offensive, though Hanser Alberto is projected for 1.3 WAR by ZIPS, while PECOTA thinks he will accumulate 0 WAR. However, it is in the pitching staff where things are most interesting for Bellingham. Three pitchers have fairly significant projection differences: Charlie Morton (2.8 ZIPS; 1.8 PECOTA), Tyler Mahle (2.3 ZIPS; 1.4 PECOTA) and Kevin Gausman (2.9 ZIPS; 2 PECOTA). All three of these pitchers were trade targets for the Cascades, so he obviously saw something in each of them that is more akin to ZIPS’ rendering that to PECOTA. All three have a great chance to contribute significantly to their team, and drive that win total closer to 90 (or more) if all goes as hoped.
Canberra: The Roos are projected by ZIPS to win the league with 99 wins, but to finish third in the other two projection systems with 92.4 wins (PECOTA) and 90.6 wins (Steamer), respectively. The Roos are a fascinating study in the differences between projections systems, because so many of their position players have projection differences larger than 1 win:
Tommy La Stella, Isaac Paredes, Carter Kieboom, Jackie Bradley, Jr., David Dahl, Kyle Tucker and Manny Margot
The most interesting projection difference, though, might be Vlad Guerrero, Jr. PECOTA, which is usually a bit more conservative in its projections, has Vladito earning 2.1 WAR. Surprisingly, Steamer is the most different from the PECOTA projection, which is abnormal (usually ZIPS is more bullish on players than Steamer). It has Vladito earning 3.4 WAR this season, for a difference of 1.3 wins. Vladito will be an interesting player to watch this year, and could be a good indicator of how the Roos will fare.
On the pitching side, the projections are remarkably consistent for the Roos. This could be a good thing and it could also be detrimental in terms of upside. Will any Roo pitchers be able to wildly outperform their projection? Doing so will be necessary in order to compete for the title.
Cottage: The Cheese high win mark this season is 94.4 (ZIPS), followed by 90.4 (PECOTA) and 88.9 (Steamer). These win numbers place Cottage right in the middle of the EFL, a place which the Cheese undoubtedly want to leave behind this season. Doing so will take the work of several players who have some apparent discrepancies in regard to their projections. For instance, new Cheese Alejandro Kirk is projected by PECOTA to only earn .3 wins, but ZIPS projects Kirk to earn 2.1 wins – a remarkable difference! Will Kirk get the playing time he needs to get closer to 2 wins than 0? How about bench player/OHer extraordinaire Marcus Semien? ZIPS thinks he will accrue 3.9 wins while PECOTA believes he will earn 2.1. There is another 2 wins right there! Finally, on the pitching staff, the Cheese (who are thin in terms of their volume of pitchers) have relatively few discrepancies, namely two Angles hurlers. ZIPS Andrew Heaney will earn 3 WAR while PECOTA thinks he’ll muster only 1.4 WAR. His teammate in the EFL and IRL, Shohei Ohtani, is projected for 1.2 WAR by ZIPS but a mere .1 WAR by PECOTA. A Cheese year which ends in laud instead of lament will perhaps rest on 4 winged creatures (2 Jays and 2 Angels) – or, in heteronym style, they will be a dove ascending into the skies or will have dove into the depths of misery.
DC: The Balk’s projections are pretty consistent across all three systems (ZIPS: 89.3; Steamer: 87.9; PECOTA: 90.8), which means Rob should feel pretty confident about getting 90 wins – a good season. But what could make it great? Simply put, it will be the pitchers. The Balk offense is considered but all three projection systems to be solid, though they each emphasize different players. For instance, PECOTA thinks Joey Gallo will out-WAR Xander Bogaerts by .1 win, but ZIPS believes Bogaerts will out-WAR Gallo by almost 2 wins!
However, the pitching is where the Balk find some variance among several players, and where they might be able to inch above the 90 win mark. Here is the list of pitchers who have a variance of more than 1 win in their projections: Jose Berrios, Garret Crochet, Triston McKenzie, Matt Wisler and Dylan Cease. And Joe Musgrove missed the list by .1 win. That is more than half of the Balk pitching staff!
Flint Hill: The Tornadoes are projected to finish in first place in two of the 3 projections systems (Steamer and PECOTA), and 4th in the other (ZIPS). 4th! How is that possible? The main reason is that ZIPS thinks the pitching staffs of other teams in the league are more valuable than PECOTA or Steamer do. What does that mean? Well, I don’t know, and the Tornadoes can’t do anything about it since it has nothing to do with the actual Tornado projections. Flint Hill will need its catchers to outperform their projections, since right now the two slated to make the MLB roster combine for .2 WAR – awful. Though Ron’s earlier projection of 130 wins for the Tornadoes, Flint Hill will be happy with 100 (which means beating all three projections systems by 4-8 games – a tall task, but necessary if a repeat championship is desired.
Haviland: The Dragons are projected to win 89-90 games this season, with only a 3 win variance between the three projection systems. When there is not a lot of variance in win totals across all 3 systems, one reason could be that all three projection systems value the players similarly. Which is the case with the Dragons, and I’m not sure if that is a good thing or not. I know that the Dragon owner is by nature a deliberate person, and perhaps his research of players includes those that are viewed similarly by all three systems – that is certainly a safe way to form a team. But safe doesn’t win a lot of competitions, though I don’t believe the Dragon ownership is under any kind of illusion that they might win this year. The main differences in projections? Jose Iglesias is projected for 1.2 more wins in ZIPS than in PECOTA; Joc Pederson is projected by PECOTA for 1.4 more wins than he is in ZIPS. Among the pitchers, Domingo German is projected for 1.2 more wins in ZIPS than in PECOTA, while Jesus Luzardo is projected for 1.3 more wins in Steamer than in PECOTA. But that’s it. Everyone else has projections that are similar across all three systems, which might mean the Dragons are more certain for 90 wins than anyone else. Which, according to preseason numbers, will be good enough to finish middle of the pack in the EFL.
Kaline: The Drive have similar projections to the Dragons – 88-90 wins total. And like the Dragons, there is not a lot of variance in their projections. On the offensive side, there are a couple of hitters who, if they can earn towards the upper end of their projections could move the Drive closer to mid-90s in the win column. The two players are Daulton Varsho and Jesse Winker. Varsho is projected by Steamer for .9 WAR, while PECOTA (usually the most conservative of the three) projects him for 2.5 WAR. In terms of Winker, ZIPS projects him for 1.2 wins while PECOTA projects him for 2.5 wins. On the pitching staff, Max Fried has the most variance, with 1.5 WAR projected by PECOTA while ZIPS projects 2.7 WAR. The rest of the pitching staff is viewed by the three systems to be solid in terms of how they will produce.
Old Detroit: The Wolverines were already privy to my comments about their spreadsheet prowess. However, I imagine the Wolverine management is hoping their high water mark is not those same sheets. It is well-documented that Old Detroit is projected for a significant number of wins, even after the unfortunate injury to Eloy. Before the injury to Jimenez, the Wolverines are the only team projected to finish in the exact same spot – in their case, 2nd place. Though the remained in second place in PECOTA and Steamer, they fell all the way to 4th in ZIPS. Where might there be some variance in their projections?
The Wolverines have a player with one of the most divergent projections of anyone in the EFL – Will Smith. In Steamer, Smith is projected for 1.6 WAR, which for a catcher is respectable. But in PECOTA? Smith is projected for an incredible 4.2 WAR – a difference of 2.6 WAR! The earliest reports out of Dodger camp (Smith to play in approximately 90 games) lend towards a projection closer to Steamer, but I imagine he could find his way into more playing time with a solid April. And how about Tommy Edman? Edman is projected for 1.2 WAR in Steamer, but 3.2 WAR in PECOTA. In these two players is enough variance to catapult the Wolverines into first place or drop them into the middle of the pack. Among the pitchers, only two of them have some degree of difference in their projections – Marcus Stroman and Chris Paddack. Stroman is projected for 1.2 WAR in PECOTA and 2.3 in Steamer, while Paddack is 1.4 in Steamer and 2.6 in the other two systems.
Peshastin: The Pears have perhaps the wildest projections in the EFL. Look at this: Steamer projects 83.6 wins; PECOTA projects 86.9; ZIPS? A whopping 96.5 wins! Is ZIPS is correct, the Pears will finish in 2nd place behind the Roos. But the other two systems? They have the Pears finishing in the bottom third of the league. How is this possible?
For starters, ZIPS likes Jo Adell, giving him 1.4 WAR, while the other two systems give him negative WAR. Yes, that’s right…negative. ZIPS also loves Willi Castro, assigning him 2.2 WAR, compared to 1.6 and 1.3 in the other systems. On the pitching side, ZIPS loves Dustin May (2.2 WAR), while PECOTA thinks he’ll do hardly anything (.9 WAR). Luis Patino is also highly rated by ZIPS (1.1 WAR) while the other two systems give him .5 (Steamer) and .3 (PECOTA) WAR. Overall, ZIPS loves the Pear players, and if I were Pear management, I might find a way to discount or ignore those other projections systems, otherwise it might be a long season.
Pittsburgh: The projection systems aren’t that impressed with the Alleghenys. Their high-water win mark is 85.2 (ZIPS), with the other two projecting fewer than 80 wins. There are some interesting variances in their projections. For instance, Garrett Hampson is projected by PECOTA to earn 2.3 WAR by PECOTA, and -.2 WAR by Steamer – the second largest difference in the league behind Will Smith of the Wolverines. On the pitching side, Packy Naughton is projected by ZIPS to earn 1.1 WAR, while PECOTA has him worse than replacement, at -.2 WAR. Additionally, Ranger Suarez is set to earn 1.1 WAR according to ZIPS, while PECOTA has him earning -.2, as well (editor’s note: Suarez was DFAd, so Pittsburgh seems to place more weight in non-ZIPS projections).
Portland: The good news for the Rosebuds is that, after a year of finishing last in the league, there is only one projection system placing him last (PECOTA). In Steamer he is projected to finish second to last, but in ZIPS he is projected to finish 7th, just behind the Dragons. Willians Astudillo is projected to earn almost 2 WAR (1.8) by ZIPS, but only .1 by Steamer. In terms of star power, Corey Seager seems to be undervalued by PECOTA (4 WAR), while the other two systems value him as a superstar, with Steamer projecting a whopping 5.3 WAR. The Rosebud pitching is very interesting. As a staff, ZIPS says they are worth almost 20 WAR, which would land them in 4th place compared to other EFL teams. But the other two systems project them for 11.9 (Steamer) and 10.1 (PECOTA) WAR. That is a major difference! The biggest culprits are Bryse Wilson, Daniel Norris, Nick Margevicius, Lewis Thorpe, Trent Thornton and Sean Newcomb (no surprise the list is this long with the difference between the systems). That’s a lot of variance, and if those pitchers can perform at the top end of their projections, or even outperform them, it could mean the Rosebuds move closer to the top than the bottom.
To close, there are some close finishes projected between the EFL teams. Will our teams need to buffet against a strong headwind, or be able to feast from a veritable buffet of wins? Here’s to hoping the contest is close enough to contest the final standings with a final calculation on the last day of the season. We hope you have been content with this content…now, let’s play ball!