
Bill James published Wednesday a study on whether baseball is now in a clear transition to a new generation of stars.
I won’t try to describe his method — I think you can read it yourself here even if you don’t subscribe to Bill James’ website — other than to say he arbitrarily sets the number of stars as 2 times the number of teams. He concludes that normally generational shifts are not clear cut. Stars’ careers overlap and intertwine, so turnover is gradual — about 20.9% per year, on average. (This holds true whether there are 32 stars or 60 in a particular year.) However, turnover can be as low as 9% in a year, and as high as 30% — or even higher, in tumultuous times.
Those tumultuous times are the ones you’d expect:
- 1900 to the early 1920’s, affected by the establishment of the major leagues, the Federal League and the end of the deadball era;
- World War II.
Since World War II, the rate of turnover from year to year has reached 30% only twice: 1967 to 1968 and 1992 to 1993. Both appear to be random spikes; the years adjacent to them are all about average.
The most stable years in MLB history were from 1929 to 1933, when year-to-year turnover averaged less than 10%. Years just before and after then were also highly stable. This would be expected, I would think, after the turmoil leading into the live-ball era had sorted out. The skills players needed had changed — after a few years’ delay while teenagers who copied Babe Ruth were making their way into the game, the new generation would push out the old-timers at a higher – than – normal rate, excelling at a younger than normal age and then hanging on until they reached the normal age of decline.
The 1950’s were a time of stability, too, not as marked as the 1929-33 era, but still easily understood: part of the generation of younger players that should have been pushing out veterans was missing, dead in WWII.
The most recent period of remarkable stability — not as high as 1929-33, but stretching over a longer period, was 1996 – 2003. During that time the rate of change never got above 16.6% annually. The lowest rate of change ever recorded was 2001-2002: only 8.4%.
I got to thinking about this last night. We had 5 straight years of remarkably stable stars (turnover rates of 11.7%, 10.4%, 16.4%, 16.2%, 16.7%) and THEN we had the most stable year-to-year star list ever? Shouldn’t the pressure from younger players be building up all that time? Wouldn’t it be likelier that, after the longest stretch of such low turnover rates in the history of the game, the 2001-2002 year would be among the LEAST stable instead of the very MOST stable?
And it’s not like the dam finally broke the next year. From 2002 to 2003, the rate of turnover was only 11.5%. Then it ran 19.9%, 19.3%, and 19.1% — still below average. Then in 2006-07 the rate was 16.4%; 2007-08 12.1%, and 2008-09 back up to 19.2%. Only in 2009-10 did we get an above-average turnover rate (25.7%). (And it has been above average every year since then, except for last year.)
Those 2009 new stars were not the kids who were suppressed starting in 1996 finally breaking through. Those missing 1996 stars would be in their mid-30’s by 2009. They missed out entirely, denied a chance that should have been theirs. Instead of getting to see an average of 12.5 new stars every year among those top 60 from 1996 – 2009, we got to see only about 9.1. Over the 13 years straight years that turnover was below average, more than 44 players did not get to be stars who would have in normal times.
So here you have another way of understanding the impact of steroids: it entrenched a generation of stars. Almost 1/3 of the players who would normally have become stars were shut out during the “steroid era.”
This analysis would suggest that about 1/3 of the stars of the 1996-2009 era were steroid frauds. Some would never have been stars without steroids. Others — Barry Bonds, Roger Clemens, Arod, etc — didn’t need PEDs to become stars, but extended their dominance, maybe by 33%. Either way, they were displacing others who should have been stars in their stead for at least part of the time.
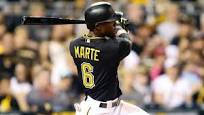
So now I have another reason to seethe about steroids. Starling Marte: you will never play for the Wolverines. Get out of my sight. I should release you. Instead I banish you to our lowest farm team, the Sterling Heights Shrews. Go join the guy whose spot you stole.
…
Now what does this have to do with the EFL? Do we have a steroids problem?
No. But it sure looks like we are having some delayed generational change.
For the first 13 years, there was almost no change in the “stars” of the EFL.
Year one: with only 4 teams, there could only be one star: the Wolverines!
Year two: Now with 6 teams, maybe we could have 2 stars? I hope so, because the Alleghenys won in their first year. For the first 8 years it was all Alleghenys and Wolverines.
In year 9, the Dragons won. Then the Wolverines, then the Alleghenys, then the Dragons twice more.
Who is starring now? Not the Wolverines, buried alive (sort of) in 9th place, the only visible unlocked exit being downward, through the door marked “Emergency Room.” The Alleghenys and Dragons, on the other hand, are still competing tooth and nail… for fourth place.
The stars are the Cheese … and maybe the Drive and the Tornadoes, who seem to think they might still catch the Cheese. So we still might have three stars, representing 100% turnover.
This turnover is long overdue. I’ve worried that our rules might be too onerous to teams who arrived late or fell on hard times, that maybe those of us who were winning were the equivalent somehow of steroid users. This year encourages me. It tells me there really are ways out of the cellar. It will be fun to try to find them for the Wolverines.
| EFL | ||||||
| TEAM | WINS | LOSSES | PCT. | GB | RS | RA |
| Cottage Cheese | 29 | 13 | .699 | — | 242.9 | 157.5 |
| Kaline Drive | 27 | 14 | .648 | 2.3 | 189.5 | 139.7 |
| Flint Hill Tornadoes | 23 | 15 | .603 | 4.4 | 179.8 | 145.3 |
| Haviland Dragons | 24 | 17 | .590 | 4.7 | 238.4 | 199.4 |
| Pittsburgh Alleghenys | 22 | 15 | .587 | 5.1 | 189.2 | 158.5 |
| Peshastin Pears | 23 | 18 | .563 | 5.8 | 184.7 | 169.4 |
| Canberra Kangaroos | 22 | 18 | .543 | 6.6 | 206.0 | 182.0 |
| Portland Rosebuds | 22 | 19 | .536 | 6.9 | 223.9 | 198.3 |
| Old Detroit Wolverines | 15 | 23 | .403 | 12 | 149.6 | 186.5 |
| D.C. Balk | 13 | 27 | .334 | 15 | 184.7 | 264.3 |
| AL East | ||||
| TEAM | WINS | LOSSES | PCT. | GB |
| New York Yankees | 24 | 14 | .632 | — |
| Flint Hill Tornadoes | 23 | 15 | .603 | 1.1 |
| Baltimore Orioles | 23 | 16 | .590 | 1.5 |
| Boston Red Sox | 21 | 19 | .525 | 4 |
| Tampa Bay Rays | 21 | 22 | .488 | 5.5 |
| Toronto Blue Jays | 18 | 24 | .429 | 8 |
| Old Detroit Wolverines | 15 | 23 | .403 | 8.7 |
| NL East | ||||
| TEAM | WINS | LOSSES | PCT. | GB |
| Washington Nationals | 25 | 15 | .625 | — |
| Canberra Kangaroos | 22 | 18 | .543 | 3.3 |
| Atlanta Braves | 16 | 22 | .421 | 8 |
| New York Mets | 16 | 23 | .410 | 8.5 |
| Philadelphia Phillies | 14 | 24 | .368 | 10 |
| Miami Marlins | 14 | 26 | .350 | 11 |
| D.C. Balk | 13 | 27 | .334 | 11.6 |
| AL Central | ||||
| TEAM | WINS | LOSSES | PCT. | GB |
| Pittsburgh Alleghenys | 22 | 15 | .587 | — |
| Minnesota Twins | 20 | 17 | .541 | 1.7 |
| Detroit Tigers | 20 | 19 | .513 | 2.7 |
| Cleveland Indians | 20 | 19 | .513 | 2.7 |
| Chicago White Sox | 17 | 22 | .436 | 5.7 |
| Kansas City Royals | 17 | 23 | .425 | 6.2 |
| NL Central | ||||
| TEAM | WINS | LOSSES | PCT. | GB |
| Cottage Cheese | 29 | 13 | .699 | — |
| Milwaukee Brewers | 24 | 18 | .571 | 5.3 |
| St. Louis Cardinals | 21 | 17 | .553 | 6.3 |
| Chicago Cubs | 21 | 19 | .525 | 7.3 |
| Cincinnati Reds | 19 | 21 | .475 | 9.3 |
| Pittsburgh Pirates | 18 | 23 | .439 | 10.8 |
| AL West | ||||
| TEAM | WINS | LOSSES | PCT. | GB |
| Houston Astros | 29 | 12 | .707 | — |
| Kaline Drive | 27 | 14 | .648 | 2.4 |
| Haviland Dragons | 24 | 17 | .590 | 4.8 |
| Texas Rangers | 22 | 20 | .524 | 7.5 |
| Los Angeles Angels | 22 | 21 | .512 | 8 |
| Seattle Mariners | 20 | 22 | .476 | 9.5 |
| Oakland A’s | 18 | 23 | .439 | 11 |
| NL West | ||||
| TEAM | WINS | LOSSES | PCT. | GB |
| Colorado Rockies | 26 | 15 | .634 | — |
| Los Angeles Dodgers | 24 | 18 | .571 | 2.5 |
| Arizona Diamondbacks | 24 | 18 | .571 | 2.5 |
| Peshastin Pears | 23 | 18 | .563 | 2.9 |
| Portland Rosebuds | 22 | 19 | .536 | 4 |
| San Francisco Giants | 17 | 25 | .405 | 9.5 |
| San Diego Padres | 15 | 28 | .349 | 12 |