Straight outa Baseball Prospectus:
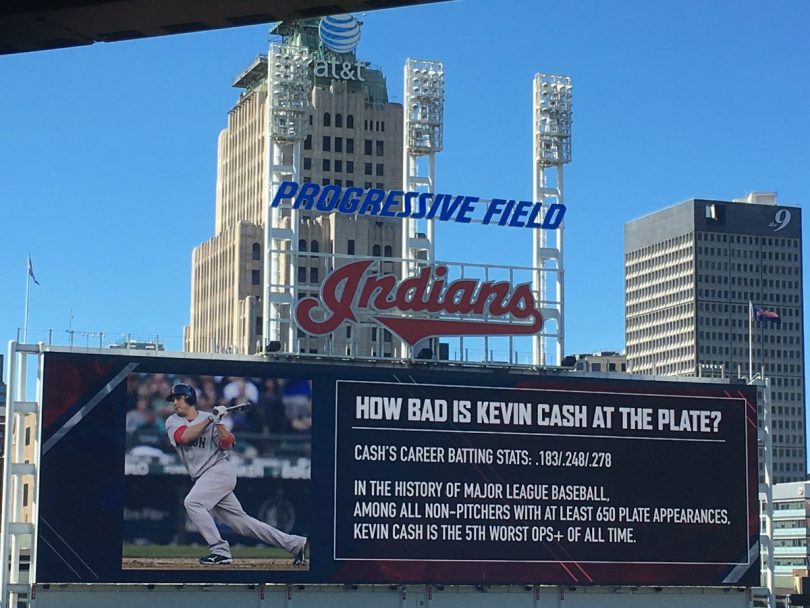
Indians skipper Terry Francona pranked Rays manager Kevin Cash during batting practice on Monday.
This strangely inspires me, in multiple directions. My first reaction was snark. “Oh, you mean, even worse than Manny Machado?”
That lead naturally to consider who among our players might actually be below the Cash line — ie, in line to replace him in the bottom 5 of MLB hitters all time. That .183, .248, .278 line is pretty abysmal with its .526 OPS, but it doesn’t strike me as unfamiliar.
(Yes, I know, Francona refers to OPS+, which puts Cash’s .526 OPS in the context of league-wide offense during his career, 2002 – 2010. We’ll just use straight OPS for today. According to Fangraphs, Cash has the 60th-worst career OPS for non-pitchers with at least 650 plate appearances. So we’d really be looking for people in the bottom 60 all time. But bottom 5 sounds so much more… definitive. )
(And anyway, even using raw OPS doesn’t help Mr. Cash. I glanced through BP’s list of the 59 players with worse OPSes. The only other one I found who is younger than 50 (Cash is 39) was EWIE Brandon Wood, whose career OPS was .513 over 751 plate appearances. There were guys on the list who would be 157 years old if they were still counting. )
Then I wondered if you could extend this principle. Would it be possible to concoct “Cash Lines” for other aspects of baseball performance?
By the way, Mario Mendoza of “Mendoza Line” fame is 26th-worst on the all-time list at a .507 career OPS. So the Cash Line is not as abysmal as the Mendoza Line. I mean, being hailed as below the Cash Line would be embarrassing, but it shouldn’t throw a person into ultimate despair.
So…
EFL Standings for 2017
| TEAM |
WINS |
LOSSES |
PCT. |
GB |
RS |
RA |
| Cottage Cheese |
26 |
10 |
.729 |
— |
217.4 |
132.0 |
| Kaline Drive |
25 |
14 |
.631 |
3.1 |
184.1 |
140.9 |
| Flint Hill Tornadoes |
22 |
13 |
.623 |
3.9 |
168.0 |
130.2 |
| Peshastin Pears |
23 |
16 |
.581 |
5.1 |
175.4 |
153.5 |
| Pittsburgh Alleghenys |
19 |
15 |
.573 |
5.8 |
167.4 |
145.1 |
| Haviland Dragons |
22 |
17 |
.559 |
6 |
215.2 |
192.3 |
| Portland Rosebuds |
21 |
18 |
.527 |
7.2 |
207.3 |
187.8 |
| Canberra Kangaroos |
19 |
18 |
.518 |
7.6 |
181.4 |
170.7 |
| Old Detroit Wolverines |
14 |
21 |
.400 |
11.7 |
134.6 |
169.8 |
| D.C. Balk |
13 |
24 |
.354 |
13.6 |
178.4 |
243.4 |
.
Cottage: W (-1), L 1; 3 – 6. (.400, .538, 1.000; 11 ip, 9 er). Not playing a game, and getting only 10 AB anyway, will suppress offensive totals. Pitching, too. This is why the score isn’t 15 – 8. It’s nice to see the Cheese get to double-digits in losses. And there are more losses to come! We might see them get all the way into the 40’s before the season is over, at their current pace.
.
As for the Cash Line? How about pitching? The 60th worst career ERA for pitchers with at least 200 innings belongs to Bon Wiesler at 5.74 (1951-58, for the Yankees and Senators). The highest career ERA Fangraphs records for pitchers with at least 200 career innings is 6.99 for Bill Kissinger (1895-97). More recently the Mariners’ Ken Cloude retired with a 6.56 career ERA over 278.2 innings, the 9th-worst mark. The Cheese had THREE pitchers achieve sub-Cash-line results yesterday: Sean Manaea’s 5 ip, 4 er; Grant Dayton’s 1 ip , 2 er: and my favorite, Chris Archer’s 5 ip, 6 er. Go Cheese hurlers!
.
Kaline Drive: W 1, L 1; 10 – 16. (.206, .372, .412; 6.7 ip, 5 er). The Drive slipped a little further behind the Cheese Monday. Seven hitters turned in sub-Cash performances (OPSing below .526. Two pitchers did the same, although Marc Rzepczynski turned in a perfect 1/3 of an inning. But here’s the thing: for the season so far, not a single pitcher is sub-Cash, and only one hitter (Leonys Marin, with his .302 OPS). Of the 29 Drives with 2017 stats, only 1 is sub-Cash! That’s amazing. And better than the Cheese, who also only have one sub-Cashian (Greg Bird, at .450 OPS). But with only 25 Cheeses with season stats, the Drive’s ratio is better.
.
Flint Hill: W, 2 – 1. (.063, .200, .125; 8.7 ip, 1 er). The Tornadoes had a profoundly sub-Cashian day. But then, the pitchers inflicted the same on their opponents, so the Tornadoes could squeeze out a win, thanks to Tony Zych coming on in the ninth inning with the bases loaded with one out and the bases full — and getting out the jam. It may not look like much, but it gained them 0.5 games on the Cheese. The Tornadoes have one hitter (Byron Buxton!, .505 OPS) and two pitchers (Kyle Kendrick, 12.96 ERA; Brian Johnson, 7.20 ERA) on the wrong side of the Cash line.
.
Peshastin: W 2, L (-2); 9 – (-3). (.414, .514, .862; 5.7 ip, 5 er) I suspect I miscopied Peshastin stats yesterday, because the offensive numbers were off yesterday, and the pitching stats aren’t right today. Carlos Carrasco had a terrible day — 3.7 ip, 5 er: how that translates into negative runs on the day is hard to explain. I will try to dig into the Peshastin numbers and diagnose what’s been going on. For the season, the Pears have no sub-Cash hitters, and only three pitchers (and Carrasco isn’t one of them).
.
Pittsburgh: DNP, 2 – 0. (.316,.386, .526; 2 ip, 1 er). Dansby Swanson (.510 OPS for 2017) is the only Allegheny sub-Cashian hitter — and he made a lot of progress toward overcoming that mark yesterday, going 2 for 4 with a double. Miguel Diaz (9.98 ERA on the season) and Adelberto Mejia (5.79 ERA) are the only two Allegheny sub-Cashian pitchers on the season.
.
Haviland: W 1, L 1; 2 – 4. (.200, .278, .467; no pitching). It wasn’t so much that players were failing to meet the Cash Line (although Colby Rasmus did go 0 for 5). They just failed to play. For the season, Jabari Blash was just under the Cash Line (.523) when he got benched. Now Raimel Tapia is even further sub-Cashian (0.111 OPS!). Four Dragon pitchers have ERA’s above 5.74 — Tyler Glasnow and Kevin Gausman the headliners, both with ERA’s in the 7’s.
.
Portland: DNP, ( -1) – 0. (.227, .370, .318; no pitching). Four Rosebud batters wish they had Kevin Cash’s numbers: Jeimer Candelario (.170 season OPS); Cheslor Cuthbert (.406); Carlos Perez (.154), and Raul Mondesi (.346). Also they have two pitchers trans-Cash: Adam Conley (7.53) and Junior Guerra (6.00).
.
Canberra: DNP, (-2) – (-1). (.118, .167, .353; 0.7 ip, 0 er). That hitting line is below Cash level, but just barely (.520 v. .526) and only comprising 18 plate appearances. Christian Bethancourt (.286) and Alen Hanson (.463) are batting below Cash for the season, while Michael Tonkin and Dan Altavilla are above Cash with identical 11 ip, 8 er, 6.55 ERA lines.
.
Old Detroit: L, 4 – 8. (.167 .286, .250; no pitching). The entire team just barely avoided going trans-Cash yesterday, although some credit should go to the only 3 guys (Ahmed, Hedges, and Yelich) to show up to play. Old Detroit’s only two sub-Cashian hitters on the season, Profar and Vogelbach, are in the MLB minors where they can do no harm other than to the dreams of Wolverine fans. Our trans-Cashian pitcher for the season is Francisco Liriano — only him, not any others — at 6.25 ERA. This is shocking — I expected to lead the league in Cash-line violations.
Of course, if we expanded the inquiry in Cash-line managing, the Wolverines would be standouts. Last year at this time the W’s were 23-13, practically tied for first in the AL East. This year they’re 14 – 21, the worst record in the American League. That’s an 8 1/2 game collapse, tumbling .236 in winning percentage.
But is it the worst in the EFL? A year ago the Canberra Kangaroos were in first at 28 – 10, .742 winning percentage — even better than the Cheese! Now the ‘Roos sit only one place above the W’s, just like last year. But Canberra is 19- 18 with a .518 winning percentage, only .224 worse than 2016. On the other hand, they’re only 4.1 games ahead of Old Detroit, rather than the 4.3 game lead they held last year. So I guess it’s up to you. Either the Kangaroos, or the Wolverines, have fallen the farthest in one year — 7 places in the standings, 7.6 or 7.4 games further behind, with winning percentage fallen by about .230 points.
The Rays, on the other hand, under the actual Kevin Cash are 19 – 22 (.463) today. They were 16 – 19 (.457) last year. Thus, the ‘Roos and W’s both are sub-Cashian as managers. In fact only two MLB teams rival the ‘Roos and ‘W’s for year-to-year collapse: The White Sox (24 – 14, .632 to 17 – 19, .472) and the Phillies (22 – 16, .579 to 14- 21, .400) — both of them smaller in terms of games behind and winning percentage. So we could say that the Mock boys may have established the Cash line for managerial performance: costing your team .230 points in winning percentage year to year.
DC: DNP, 0 – 4. (.250, .294 .438; 5.7 ip, 1 er). Two sub Cashian hitters (Adonis Garcia and Brock Holt), two trans-Cashian hurlers (Sam Dyson, still 10.66 ERA, and Robert Gsellman at 7.07)… and ZERO sub-Cashian managers (having improved his team’s record from 11 – 27 (.288) to 13 – 24 (.354).
Combined MLB + EFL Standings for 2017
| TEAM |
WINS |
LOSSES |
PCT. |
GB |
| New York Yankees |
22 |
13 |
.629 |
— |
| Flint Hill Tornadoes |
22 |
13 |
.623 |
0.2 |
| Baltimore Orioles |
22 |
14 |
.611 |
0.5 |
| Boston Red Sox |
19 |
18 |
.514 |
4 |
| Tampa Bay Rays |
19 |
22 |
.463 |
6 |
| Toronto Blue Jays |
17 |
22 |
.436 |
7 |
| Old Detroit Wolverines |
14 |
21 |
.400 |
8 |
| TEAM |
WINS |
LOSSES |
PCT. |
GB |
| Washington Nationals |
24 |
13 |
.649 |
— |
| Canberra Kangaroos |
19 |
18 |
.518 |
4.9 |
| New York Mets |
16 |
21 |
.432 |
8 |
| Atlanta Braves |
14 |
21 |
.400 |
9 |
| Philadelphia Phillies |
14 |
21 |
.400 |
9 |
| Miami Marlins |
14 |
23 |
.378 |
10 |
| D.C. Balk |
13 |
24 |
.354 |
10.9 |
| TEAM |
WINS |
LOSSES |
PCT. |
GB |
| Pittsburgh Alleghenys |
19 |
15 |
.573 |
— |
| Minnesota Twins |
19 |
15 |
.559 |
0.5 |
| Cleveland Indians |
20 |
17 |
.541 |
1 |
| Detroit Tigers |
18 |
18 |
.500 |
2.5 |
| Chicago White Sox |
17 |
19 |
.472 |
3.5 |
| Kansas City Royals |
16 |
21 |
.432 |
5 |
| TEAM |
WINS |
LOSSES |
PCT. |
GB |
| Cottage Cheese |
26 |
10 |
.729 |
— |
| St. Louis Cardinals |
21 |
15 |
.583 |
5.2 |
| Milwaukee Brewers |
21 |
18 |
.538 |
6.7 |
| Cincinnati Reds |
19 |
18 |
.514 |
7.7 |
| Chicago Cubs |
18 |
19 |
.486 |
8.7 |
| Pittsburgh Pirates |
16 |
22 |
.421 |
11.2 |
| TEAM |
WINS |
LOSSES |
PCT. |
GB |
| Houston Astros |
27 |
12 |
.692 |
— |
| Kaline Drive |
25 |
14 |
.631 |
2.4 |
| Haviland Dragons |
22 |
17 |
.559 |
5.2 |
| Los Angeles Angels |
20 |
21 |
.488 |
8 |
| Texas Rangers |
19 |
20 |
.487 |
8 |
| Seattle Mariners |
18 |
21 |
.462 |
9 |
| Oakland A’s |
16 |
22 |
.421 |
10.5 |
| TEAM |
WINS |
LOSSES |
PCT. |
GB |
| Colorado Rockies |
24 |
15 |
.615 |
— |
| Peshastin Pears |
23 |
16 |
.581 |
1.3 |
| Los Angeles Dodgers |
22 |
17 |
.564 |
2 |
| Arizona Diamondbacks |
22 |
18 |
.550 |
2.5 |
| Portland Rosebuds |
21 |
18 |
.527 |
3.4 |
| San Francisco Giants |
16 |
24 |
.400 |
8.5 |
| San Diego Padres |
15 |
25 |
.375 |
9.5 |