
A wonderful, exciting, perplexing and inspiring mystery is forming atop our league. Possibly legendary, should it persist.
.
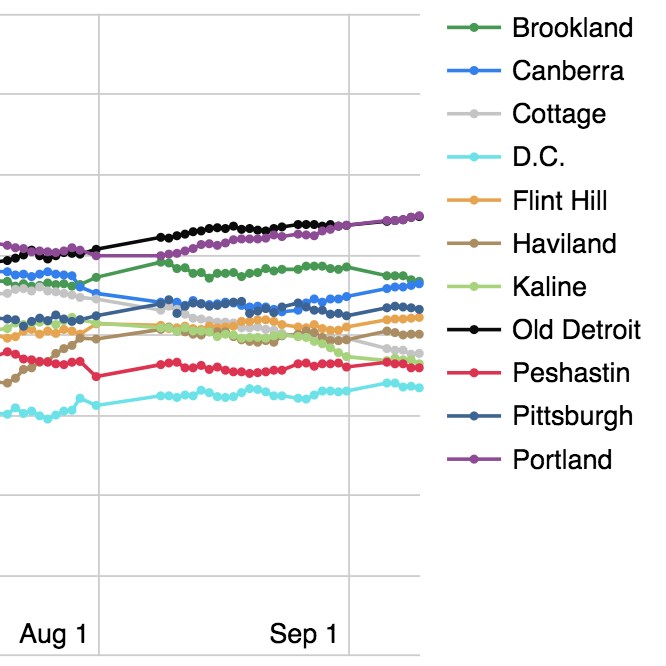
EFL Standings for 2018
| EFL | ||||||
| TEAM | WINS | LOSSES | PCT. | GB | RS | RA |
| Old Detroit Wolverines | 93 | 51 | .648 | — | 736.1 | 526.4 |
| Portland Rosebuds | 92 | 50 | .649 | 0.2 | 777.5 | 554.7 |
| Brookland Outs | 81 | 61 | .567 | 11.7 | 749.7 | 661.7 |
| Canberra Kangaroos | 81 | 62 | .564 | 12.2 | 665.5 | 588.6 |
| Pittsburgh Alleghenys | 76 | 67 | .532 | 16.8 | 752.0 | 711.1 |
| Flint Hill Tornadoes | 75 | 69 | .522 | 18.1 | 678.1 | 640.2 |
| Haviland Dragons | 72 | 71 | .501 | 21.2 | 678.0 | 669.7 |
| Cottage Cheese | 68 | 74 | .477 | 24.6 | 674.6 | 709.3 |
| Kaline Drive | 66 | 77 | .464 | 26.5 | 615.9 | 665.0 |
| Peshastin Pears | 65 | 77 | .459 | 27.2 | 607.2 | 661.9 |
| D.C. Balk | 62 | 81 | .434 | 30.8 | 615.4 | 703.6 |
.
Old Detroit: W 2, L 0; 23 – 8. (103 PA, .293, .437, .512; 44 ip, 21 er, 4.30 ERA)
Portland: W 2, L 0; 18 – 5. (120PA, .286, .377, .482; 21 ip, 4 er, 1.71 ERA)
Except for Saturday, when the Wolverines were temporarily phamished, and then dephamed, these two teams have produced almost the same exact outcome every day since we started doing September updates on Thursday: The Wolverines get a great batting line and a middling pitching line. I get all excited. But then the Rosebuds produce slightly better numbers, so much that I have expected every morning to see Portland in first place. But every morning the Wolverines are still in front. The margin is 0.2 games or less, but day after day the W’s just barely keep their lead despite better Rosebud raw numbers.
How are the Wolverines doing this?
Here are our raw numbers for hitting and pitching in September:
Team Portland Old Detroit
PA: 535 378
Batting Average: .276 .273
OBP: .368 .365
SLG: .508 .518
IP: 101.3 101
ER: 36 49
ERA: 3.20 4.37
ER per game: 5.14 6.12
.
There isn’t much daylight between the two teams’ raw offensive numbers. We have remarkably similar offenses, except the Rosebuds have a lot more plate appearances which should make them better able to respond if holes open up due to injuries or September shenanigans with prospects replacing our guys, etc. Apparently that hasn’t been happening much, yet.
The Rosebuds’ raw pitching numbers are significantly better than Old Detroit’s. The same volume of pitching has allowed only 73.5% as many earned runs in Portland. If we were using our raw numbers, the Rosebuds would be pulling away in the standings
Why isn’t this happening? Is it better allocations by the W’s? Consider these September EFL stats for each team, which show our results after our allocations:
Team Portland Old Detroit
Batting Average: .308 .297
OBP: .396 .394
SLG: .562 .582
RC/G: 8.19 8.58
Replacement PA: 0 0
Unused PA: 108 26
IP 67.9 59.5
Replacement IP: 3.4 0.8
ERA 2.94 3.53
Defense: 37.1 36.2
Runs Scored: 57.3 68.6
Runs Allowed: 21.9 30.4
Runs Allowed per game: 3.13 3.80
Winning Percentage: .873 .836
Record: 6 – 1 7 – 1
(REAL Record: 6.11 – 0.89) (6.69 – 1.31)
The Wolverines are scoring 0.39 more runs per game than the Rosebuds, while allowing 0.67 more. So the W’s are gaining a little from their allocations on both offense and defense. They are also gaining a teensy bit in some other numbers that don’t show up in OPS:
Team Portland Old Detroit
SB 5 11
CS: 1 3
GDP: 6 4
SH: 0 1
IBB: 5 3
SO: 63 62
Those extra stolen bases are helping just a smidge. The W’s having played 8 to the ‘Buds’ 7 means Portland is striking out at least once more per game, accounting for 0.03 runs per game of the Wolverines’ advantage. The Portland’s extra GDP’s also take some wind out of their offense, a little more than a single’s worth each time. And it’s likely those extra 82 unused plate appearances are storing up quite a few runs.
But that isn’t enough for them to keep up — the Rosebuds are still generating a bigger differential between runs scored and runs allowed. So the rest of the Wolverines’ advantage is embodied in the extra game they have played. Add one game at our current September winning percentages and the Rosebuds will surge to a 0.65 game lead. Add the other game the Rosebuds were short coming into the month, and we’re up to a 1.5 game lead.
On the other hand, it’s unlikely that either team can keep up a winning percentage above 0.800 all month. Which team will crack first? Which will crack hardest? BP still projects the Rosebuds to gain 6.4 games on a replacement team, while the Wolverines are supposed to gain only 5.0. Portland is still far deeper than Old Detroit. So the odds are still with Portland. But every day the W’s maintain that 0.2 game lead, a little more light leaks into Old Detroit’s dark prospects.
.
Brookland; W 1, L 1; 3 – 12. (86 PA, .160, .267, .333; 6.3 ip, 5 er, 7.11 ERA).
Canberra: W 2, L o; 13 – 6. (76 PA, .278, .308, .528; 4 ip, 1 er, 2.25 ERA).
The Kangaroos seem to be on course to retake 3rd place from the Outs. Canberra’s September winning percentage so far is .805, generating a 7 – 2 record (really 7.25 – 1.75). Brookland, on the other hand, is currently suffering through a 0.278 winning percentage spell, generating a 2 – 6 (actually 2.22 – 5.78) September record. These things are hard to turn around, so even if the teams suddenly return to their normal performances, the Outs should continue to collect extra wins as the teams glide back toward their means. BP projects the Outs to gain 4.5 games on replacement over the rest of the season, while it gives the ‘Roos 4.7 games. This could be another very close race.
.
Pittsburgh: W 1, L 1; 11 – 14. (88 PA, .266, .318, .620; 11.7 ip, 7 er, 5.40 ERA).
Flint Hill : W 1, L 1; 19 – 13. (85 PA, .342, .388, .570; 11 ip, 8 er, 6.55 ERA).
Haviland: W 2, L 0; 19 – 16. (87 PA, .286, .483, .444; 16.3 ip, 12 er, 6.61 ERA).
These three mid-league teams are in a race for the pivot position in the league (6th place, currently held by the Tornados). This weekend they featured similar offenses and pitching performances, at least in terms of net effect: lots of runs scored, and lots of runs allowed. But they reach these achievements via different paths. Pittsburgh emphasized slugging, amassing an isolated power of .354 with 7 homers, two triples, and 3 doubles — that’s 12 extra base hits from 10 players. On the other hand, the Dragons’ main weapon was the free base: 21 walks and 3 hbp. Those walks elevated the Dragons’ OBP by 197 points! Haviland’s 543 walks on the season trail only the Wolverines’ 552, but a couple more days like these last two should give the Dragons the league lead.
.
Cottage: W 1, L 1; 7 – 16. (47 PA, .238, .298, .357; 11.3 ip, 5 er, 3.97 ERA)
Kaline: W 0, L 2; 6 – 14. (81 PA, .188, .247, .304; 11.3 ip, 5 er, 3.97 ERA).
Peshastin: W 0, L 2; 8 – 17. (78 PA, .197, .269, .310; 13.3 ip, 11 er, 7.42 ERA).
D.C.: W 1, L 1; 7 – 9. (60 PA, .255, .317, .345; 7.7 ip, 3 er, 3.52 ERA).
Some notes for our teams forming the foundation of the league:
* Yes, the Cheese and the Drive had identical pitching lines. So cute!
* The Drive drove in runs with five sacrifice flies in two games. That’s a lot. Sacrifice flies are the greasy french fries of the batting diet. They taste good, sometimes, but overall they do not nourish your runs created per game.
* Compare the teams leading the league in walks this season (Old Detroit 552, Haviland 543) with the last-place-in-walks Pears, at only 335, and you will be tempted to draw some conclusions about the role of walks in a successful team…
* They are the Balk. Therefor they should be willing to balk on their plan to leave the EFL. But if they don’t Balk, we are going to miss some of their players. Matt Chapman would be my choice if we survivors could keep a memento of the Balk for our very own.
Combined MLB + EFL Standings for 2018
| AL East | ||||
| TEAM | WINS | LOSSES | PCT. | GB |
| Boston Red Sox | 98 | 46 | .681 | — |
| Old Detroit Wolverines | 93 | 51 | .648 | 4.7 |
| New York Yankees | 89 | 54 | .622 | 8.5 |
| Tampa Bay Rays | 78 | 64 | .549 | 19 |
| Flint Hill Tornadoes | 75 | 69 | .522 | 22.8 |
| Toronto Blue Jays | 65 | 78 | .455 | 32.5 |
| Baltimore Orioles | 41 | 102 | .287 | 56.5 |
| NL East | ||||
| TEAM | WINS | LOSSES | PCT. | GB |
| Canberra Kangaroos | 81 | 62 | .564 | — |
| Atlanta Braves | 79 | 64 | .552 | 1.6 |
| Philadelphia Phillies | 74 | 68 | .521 | 6.1 |
| Washington Nationals | 71 | 72 | .497 | 9.6 |
| New York Mets | 65 | 77 | .458 | 15.1 |
| D.C. Balk | 62 | 81 | .434 | 18.6 |
| Miami Marlins | 56 | 86 | .394 | 24.1 |
| AL Central | ||||
| TEAM | WINS | LOSSES | PCT. | GB |
| Cleveland Indians | 81 | 62 | .566 | — |
| Pittsburgh Alleghenys | 76 | 67 | .532 | 5 |
| Minnesota Twins | 65 | 77 | .458 | 15.5 |
| Detroit Tigers | 59 | 84 | .413 | 22 |
| Chicago White Sox | 56 | 87 | .392 | 25 |
| Kansas City Royals | 47 | 95 | .331 | 33.5 |
| NL Central | ||||
| TEAM | WINS | LOSSES | PCT. | GB |
| Chicago Cubs | 83 | 59 | .585 | — |
| Milwaukee Brewers | 82 | 62 | .569 | 2 |
| Brookland Outs | 81 | 61 | .567 | 2.4 |
| St. Louis Cardinals | 79 | 64 | .552 | 4.5 |
| Pittsburgh Pirates | 71 | 71 | .500 | 12 |
| Cottage Cheese | 68 | 74 | .477 | 15.3 |
| Cincinnati Reds | 61 | 83 | .424 | 23 |
| AL West | ||||
| TEAM | WINS | LOSSES | PCT. | GB |
| Houston Astros | 89 | 54 | .622 | — |
| Oakland A’s | 87 | 57 | .604 | 2.5 |
| Seattle Mariners | 79 | 64 | .552 | 10 |
| Haviland Dragons | 72 | 71 | .501 | 17.4 |
| Los Angeles Angels | 71 | 72 | .497 | 18 |
| Kaline Drive | 66 | 77 | .464 | 22.7 |
| Texas Rangers | 61 | 82 | .427 | 28 |
| NL West | ||||
| TEAM | WINS | LOSSES | PCT. | GB |
| Portland Rosebuds | 92 | 50 | .649 | — |
| Colorado Rockies | 78 | 64 | .549 | 14.1 |
| Los Angeles Dodgers | 78 | 65 | .545 | 14.6 |
| Arizona Diamondbacks | 76 | 67 | .531 | 16.6 |
| San Francisco Giants | 68 | 76 | .472 | 25.1 |
| Peshastin Pears | 65 | 77 | .459 | 27 |
| San Diego Padres | 57 | 88 | .393 | 36.6 |