
This week — week 16 — is a big week for FOUR reasons! (Or is it FIVE?)
First, it’s a seven-day week. We still play only 6 games, but we get 7 days of stats to play them. This means we should find it easier to avoid replacements. After the All-Star break, we’ll resume play on Thursday, July 21 — and all the rest of the season, our weeks will run Thursday through Wednesday.
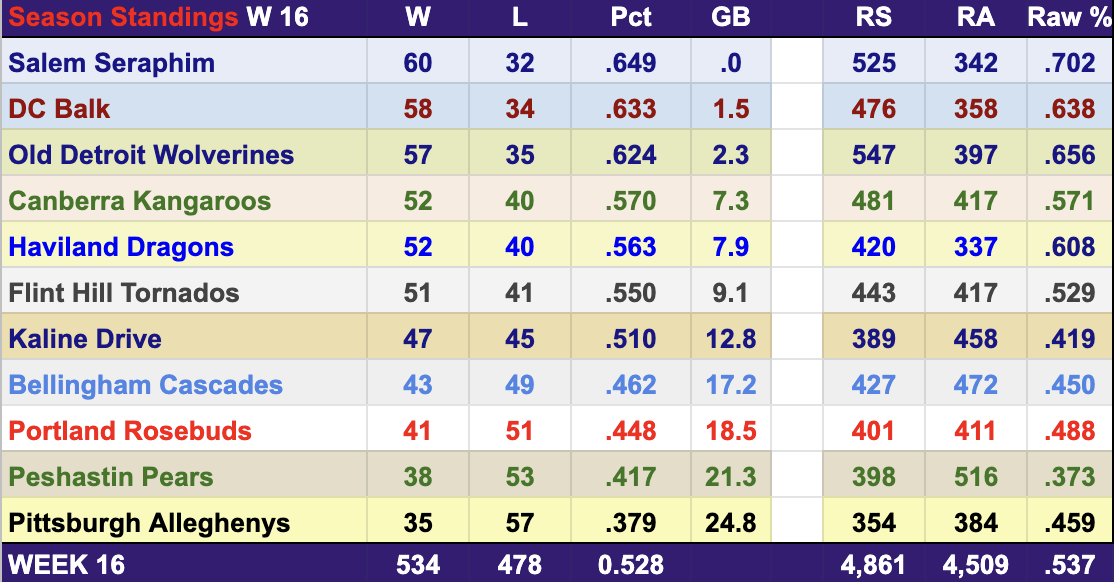
Second, seeding for the final 11 weeks of the season will be decided this week. The schedule sheet will change. We will be assigned columns based on our standings as of the All-Star Break. If the Seraphim, as expected, cling to first place through the end of the week, they will play games in column N, starting with the MLB team, and then working through the rest of the EFL starting with the team in 11th place at the Break, then the 10th place, etc, until they face off with the #2 seeded team during the last week of the season.
Those seedings are FIXED at the All-Star Break. So if you want to face the probably #1 team the last week of the season, you have to be #2 at the end of this Week 16.
I wanna be #2!! But my team has stunk it up so far this week, and DC has grabbed the lead in the race for the #2 seed.
BAD DC!
Fortunately, the standings so far this week treat us as having played just 2 games, so I have 4 games over the next 4 days to get my #2 spot back. (It would help if Eloy could play more than a week without hurting himself.) It would also help if the White Sox — my MLB competition this week — could put off getting their act together until after the Break. And it would help if the Rockies could continue to win games this week, suppressing the Balk a little better.
Or maybe we should all just root like crazy for the Giants! Even though the Seraphim have an .876 raw winning percentage this week, they are still just within reach of both the Balk and the Wolverines because the Giants have outscored their foes 16 – 4 so far, for a .941 raw winning percentage. Go Giants!
The third reason this is a big week is it’s almost the last chance for us to balance our luck with our MLB foes. I was overly confident things would even out in that regard by now. But we still have some big disparities. Here is an update of the study I did at the end of Week 15:
Wk 15 Wk 16 so far
- Kaline: + 0.091 + 0.091
- Peshastin: + 0.043 + 0.044
- Flint Hill: + 0.019 + 0.021
- Bellingham: + 0.017 + 0.012
- Canberra: – 0.007 – 0.001
- DC: – 0.001 – 0.005
- Old Detroit: – 0.019 – 0.032
- Portland: – 0.051 – 0.040
- Salem: – 0.040 – 0.053
- Haviland: – 0.041 – 0.055
- Pittsburgh: – 0.081 – 0.080
Total difference: 0.409 0.434
Ave difference: 0.033 0.039
Net difference: – 0.070 – 0.098
Ave net difference: -0.006 – 0.009
So I am reduced to hoping unrealistically we can close the gaps, when they are increasing so far this week. Sigh.
That brings us to the FOURTH big thing this week: at the end of Week16 we pick the MLB team we will take turns playing in weeks 17 – 27. The tentative plan is to pick a team we haven’t played yet which is mostly like to make our season-wide MLB opposition end up being .500 teams on average. Right now our MLB opposition has been a little above average — more like .506 or even .509 (the Average net difference figure from above).
If we want to erase that entire difference, accumulated in 16 series (96 games) against MLB teams, the one MLB team we face in 6 games over weeks 17 – 27 would have to would have to be projected to be 16 times as far below .500 as the average team we already faced was above .500. So if we’ve spent 16 weeks playing teams averaging .509 winning percentage, our one week of MLB play would need to be against a team projected for a .356 winning percentage the rest of the way.
Baseball Reference doesn’t project any team to play .356 ball the rest of way, even though Oakland and Washington are at .333 (30 – 60) right now. We’ve already played them, so the best we could do would be the Pirates, whom BR projects to play at a .386 pace from now on.
So that brings us to a FIFTH big thing: an idea I have for taking a different angle on “correcting” a little for the luck of the draw in our first 16 MLB foes. Instead of trying to adjust for the entire EFL’s luck in who we scheduled for MLB opposition, maybe we should tailor that adjustment to each EFL Team’s luck.
We have faced the same MLB teams, but we have teams getting boosts up to .091 winning percentage points, and teams getting slowed down by as much as .080. Just over our first 92 games, that’s swing of 15.6 games in the standings between the Drive and the Alleghenys!!!
I suspect this is totally realistic. It’s easy to imagine the luckiest team in MLB in terms of strength of schedule, especially when we factor in luck in catching teams on good or bad days, getting a 15-game boost in the standings over a 162-game season over the unluckiest team. I imagine the Tampa Bay Rays think about this all the time. Or the Orioles, who somehow as the last-place team in the AL East, are 45-44 right now after their Mariners-tying current 10-game win streak.
But should we temper this maybe un-fun realism?
What if we all face a different 17th MLB team, determined based on the luck our teams had during the first 16 weeks?
Here are the 14 teams we haven’t faced, according to their Baseball Reference projected rest-of-season performance:
Team W L pct
| STL | 41.2 | – | 29.8 | 0.580 |
| ATL | 40.8 | – | 32.2 | 0.559 |
| PHI | 40.5 | – | 32.5 | 0.555 |
| TBR | 40.3 | – | 33.7 | 0.545 |
| MIN | 38.4 | – | 33.6 | 0.533 |
| SEA | 38.8 | – | 34.2 | 0.532 |
| TOR | 38.5 | – | 34.5 | 0.527 |
| LAA | 36.2 | – | 36.8 | 0.496 |
| CLE | 36.8 | – | 38.2 | 0.491 |
| BAL | 35.0 | – | 38.0 | 0.479 |
| MIA | 35.8 | – | 39.2 | 0.477 |
| ARI | 33.2 | – | 39.8 | 0.455 |
| CIN | 33.1 | – | 40.9 | 0.447 |
| PIT | 28.3 | – | 44.8 | 0.387 |
So if we match the worst team (PIT) against the EFL team with the worst luck so far (PIT) we get… the Alleghenys playing the Pirates! It’s a sign from God!
There are only 4 EFL teams who’ve come out ahead from the MLB matchups, but there are 7 MLB teams projected to finish over .500. So it isn’t perfect perfect. But it is elegant.
Note that the Allegheny’s have been disadvantage by .080. The Pirates are projected to go 0.113 under .500 the rest of the way. So the PA’s disadvantage (.091) plus the Pirates’ distance from average (-.113) when added comes out to .033. It’s not perfect, but if we perform the same operation for all 11 of us, matched up with the 11 best-matched of the 14 remaining MLB teams, without duplicating any MLB teams, we get something like this:
| MLB | W | L | Proj %. (X) | .500 – | EFL | ADV (Y) | X+Y | ||
| STL | 41.2 | – | 29.8 | 0.580 | -0.080 | v. | KD | 0.091 | 0.011 |
| ATL | 40.8 | – | 32.2 | 0.559 | -0.059 | v. | |||
| PHI | 40.5 | – | 32.5 | 0.555 | -0.055 | v. | PP | 0.044 | -0.011 |
| TBR | 40.3 | – | 33.7 | 0.545 | -0.045 | v. | |||
| MIN | 38.4 | – | 33.6 | 0.533 | -0.033 | v. | |||
| SEA | 38.8 | – | 34.2 | 0.532 | -0.032 | v. | FH | 0.021 | -0.011 |
| TOR | 38.5 | – | 34.5 | 0.527 | -0.027 | v. | BC | 0.012 | -0.015 |
| LAA | 36.2 | – | 36.8 | 0.496 | 0.004 | v. | CK | 0.001 | 0.005 |
| CLE | 36.8 | – | 38.2 | 0.491 | 0.009 | v. | DC | -0.005 | 0.004 |
| BAL | 35.0 | – | 38.0 | 0.479 | 0.021 | v. | OD | -0.032 | -0.011 |
| MIA | 35.8 | – | 39.2 | 0.477 | 0.023 | v. | PR | -0.040 | -0.017 |
| ARI | 33.2 | – | 39.8 | 0.455 | 0.045 | v. | SS | -0.053 | -0.008 |
| CIN | 33.1 | – | 40.9 | 0.447 | 0.053 | v. | HD | -0.055 | -0.002 |
| PIT | 28.3 | – | 44.8 | 0.387 | 0.113 | v. | PA | -0.080 | 0.033 |
If we don’t worry about duplications, and just match up the EFL team with the MLB team whose winning percentage best fits our relative (dis)advantage:
| MLB | W | L | Proj %. (X) | .500 – | EFL | ADV (Y) | X+Y | ||
| STL | 41.2 | – | 29.8 | 0.580 | -0.080 | v. | KD | 0.091 | 0.011 |
| ATL | 40.8 | – | 32.2 | 0.559 | -0.059 | v. | |||
| PHI | 40.5 | – | 32.5 | 0.555 | -0.055 | v. | PP | 0.044 | -0.011 |
| TBR | 40.3 | – | 33.7 | 0.545 | -0.045 | v. | |||
| MIN | 38.4 | – | 33.6 | 0.533 | -0.033 | v. | |||
| SEA | 38.8 | – | 34.2 | 0.532 | -0.032 | v. | |||
| TOR | 38.5 | – | 34.5 | 0.527 | -0.027 | v. | FH | 0.021 | -0.006 |
| TOR | 38.5 | – | 34.5 | 0.527 | -0.027 | v. | BC | 0.012 | -0.015 |
| LAA | 36.2 | – | 36.8 | 0.496 | 0.004 | v. | CK | 0.001 | 0.005 |
| LAA | 36.2 | – | 36.8 | 0.496 | 0.004 | v. | DC | -0.005 | -0.001 |
| CLE | 36.8 | – | 38.2 | 0.491 | 0.009 | v. | |||
| BAL | 35.0 | – | 38.0 | 0.479 | 0.021 | v. | |||
| MIA | 35.8 | – | 39.2 | 0.477 | 0.023 | v. | OD | -0.032 | -0.009 |
| ARI | 33.2 | – | 39.8 | 0.455 | 0.045 | v. | PR | -0.040 | 0.005 |
| CIN | 33.1 | – | 40.9 | 0.447 | 0.053 | v. | SS | -0.053 | 0.000 |
| CIN | 33.1 | – | 40.9 | 0.447 | 0.053 | v. | HD | -0.055 | -0.002 |
| PIT | 28.3 | – | 44.8 | 0.387 | 0.113 | v. | PA | -0.080 | 0.033 |
If we took the last approach, we could let teams pick a harder team from this list than where they’re assigned. The Wolverines, for example, might find playing the Orioles more interesting, or even the Mariners. Although I would be torn all week between my loyalties if the W’s were playing the M’s. I’d have to pick now, though, not waiting to see if the O’s revert to their losing ways.
All these figures are as of Thursday morning. I’ll look at them again after Sunday’s games.
A program note: I leave for Seattle tomorrow morning for four days of consultations with members of a church experiencing tensions. I won’t be back in Dundee until Monday evening. I will have some time between meetings over the weekend, some of which I can devote to EFL. My suddenly cluttered schedule drove the relative neglect of the EFL these last few days, and may interrupt service for a day or two in the next week or two.
Also looming: a road trip vacation for Melanie and I starting July 30.for about 2 weeks. I think we can do monthly meeting in there, possibly in the Aug 1 – 4 period when we’ll be in Colorado.