
Our new system has introduced a powerful, addictive drug into our fantasy league. Looking at the league as a whole, one might conclude we’ve almost kicked our drug habit. And we have some owners who could give moving personal testimonies about how this drug has devastated their teams. But we also have teams ignoring those stories, and whose growing addiction threatens to reverse our league-wide move toward clean living.
LEAGUE WIDE: After our first week of play, our entire league had an adjusted adjusted winning percentage 0.069 points below what we would have had using our old system of playing generic MLB competition (.450 – .519). Since then, as one would expect, the gap between our adjusted record and our raw record has shrunk almost every week: 0.069, 0.045, 0.042, 0.033, 0.024, 0.005, 0.002.
Over the same period, our adjusted season winning percentage has generally moved toward .500: .450, .418, .451, .465, .484, .489, .498. Our season raw winning percentage started at .519, and has oscillated around .500 since then, hitting .500 for the first time (.519, .463, .493, .498, ..508, .494, .500). Before we adopted this new system, I confidently predicted this would happen. It happened faster than I thought it would, even.
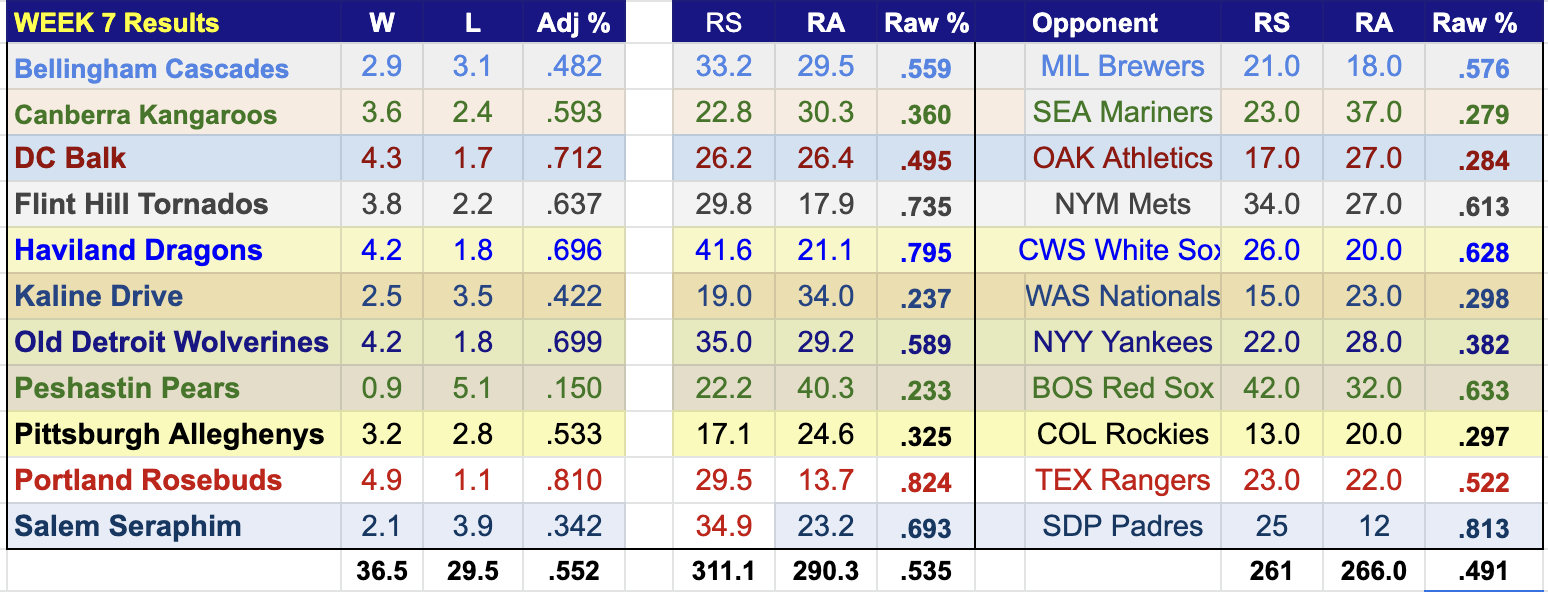
HOWEVER, on the individual team level, we have some work to do. The Kangaroos, beset all season by bad luck in their MLB-team opponents, nearly eliminated those debilitating effects. The Drive, hooked on the high they got from amazing luck in getting MLB opponents on their bad weeks, have cut back on their dosage but still by far lead the league in consumption of weak-opponent narcotics. And two teams dramatically increased their dosages, to their long-term peril.
DC: W 4.3, L 1.7 (DC: 26.6 – 26.5 ; OAK: 17 – 27) (234 PA, .269, .337, .365; 38.1 IP, 21 ER, 4.21 ERA) The Balk baaaaarely outscored their opponents, but the Athletics were bad this week, so with the 7th best raw winning percentage in the league, the Balk ended up with the second-best adjusted winning percentage. Of course, that means they ingested a lot of match-up magic powder, increasing their boost from a respectable 0.26 to a semi- scandalous 0.53, the second biggest assist from their MLB opponents in the EFL. A DISTANT second, but still… for a first place team a little embarrassing. Pete Alonso cancelled some of the embarrassment, making the cover of one of the week’s updates, and generally excelling at the plate: .959 OPS and 9.5 rc/g, going 9 for 28 with a double, 2 homers, 2 walks and a hbp.
(Note: The ERA figures in these stat lines include replacement innings this week, since I am working from the Data Entry spreadsheets rather than directly from BP’s team tracker. )
Old Detroit: W 4.2, L 1.8 (OD: 35 – 29; NYY: 22 – 28). ( .269, .382, .439; 37.2 ip, 19 ER, 4.74 ERA). The Wolverines almost kept pace with the Balk, hitting better as one would expect from the league leader in runs scored, but pitching worse. As one has reluctantly come to expect while comparing the third best pitching staff with the second best one. But I am afraid I have to confess that the Wolverines got an unexpected boost fromt the fearsome New York Yankees, who got swept by the lowly Chicago White Sox in Sunday’s doubleheader, 8 – 1. That left the Yankees in sub -.500 territory, outscored on the week 22 – 28. On the other hand, the Wolverines’ adjusted winning percentage is still 0.036 worse than their raw winning percentage, so the Yankees’ stumble was actually in the cause of justice. You Mariners fans tormented by Rafael Devers’ big week (10 for 24 with 2 doubles, a triple, 3 homers, 3 walks; .417, .481, .958; 22.3 rc/g) will take comfort, I trust, knowing that all that offense went towards a good cause: erasing a significant part of the the W’s bad luck in their MLB opposition.
Haviland: W 4.2, L 1.8 (HD: 42-21; CWS: 26 – 20) (256 PA, .257, .409, .463; 35 ip, 11 er, 3.39 ERA) Now that the ‘Roos are no longer the most abused, the Dragons take over that top spot, suffering a disadvantage of .083. If we were playing by the old system, the Dragons would have the best record in the league, 29.26-12.74, with a 0.11 game lead over the Wolverines at 29.15 – 12.85. Darin Ruf (4 for 15 with a double, 2 homers, and 7 walks for a 1.212 OPS and 14.4 rc/g) led the offense. Joe Ryan (5.7 ip, 1 er) and Tarik Skobal (5 ip, 0 er) were bright spots for a solid pitching crew.
Salem: W 2.1, L 3.9 (SS: 35 – 23; SD: 25 – 12). (.285, .372, .446; 55.3 ip, 22 er, 3.58 ERA). Salem ranks just behind the Dragons in how much they are disadvantages by the quality of their MLB opposition. Their .542 adjusted winning percentage is 0.076 points below their adjusted winning percentage. With a solid offense (which I still believe will get more productive as the season passes) and the second best pitching so far (by one run ahead of the Wolverines), they are hanging in the race here at the quarterpost. Taijuan Walker, taking his second turn in the 6-day week, and tony Gonsolin combined to cover 12 innings with 2 total earned runs to close out the week on a strong note. Mookie Betts shone at the plate: 9 for 24 with four doubles and three homers with 4 walks on the way to a .375, .464, .917 line worth 16.7 rc/g.
Canberra: W 3.6, L 2.4 (CK: 23 – 20; SEA: 23 – 37)(212 PA, .240,.306, .396; 37.3 ip, 19 er, 4.74 ERA). Canberraa struggled for the first five weeks, playing a little better than .500 in rs/ra, but each week facing either good teams or mediocre teams playing over their heads. Last week (Week 6) the Kangaroos finally had an opponent play sub -.500 ball last week. The ‘Roos played sub -.500, too, just a little better than the White Sox. They repeated the pattern this week against the Mariners. Over those two weeks, Canberra’s raw season winning percentage slipped from .530 to .503, and now to .484. But their adjust winning percentage went from .416 to .453 to .473, erasing their disadvantage from facing MLB teams by .103 out of .114 points. Isaac Paredes was the star this week, hitting 3 homers in 13 PA (plus a walk, but no other hits) to create 9.5 runs per game with a 1.209 OPS.
Kaline: W 2.5, L 3.5 (KD: 19 – 34; WAS 15 – 23). (168 PA, .221, .287, .336; 36.7 ip. 18.3 er, 4.68 ERA). The Wizard needs to knock off the magic dust; it’s addling his wits. His pitchers ACTUALLY pitched 44.7 innings — but Jose Urquidy and Glenn Otto were only allocated 33%, so their 17.7 innings only counted for 5.9. Otto’s ERA was 3.00, and Urquidy’s was 3.86, so that 4.68 ERA could have been more like 4.2, and the Drive’s dependence on magic dust could have been a bit lower.
Portland: W 4.9, L 1.1 (PR: 30-14, TEX: 23 -22) I apologize for skimping on these last four teams — I am running late and you need to see this before 5:00 allocation deadline. The Rosebuds had the best raw winning percentage for the week (.824) AND the best adjusted winning percentage (.810), which is how they gained 3 spots on the ladder and moved 0.5 games closer to the Balk.
Peshastin: W 0.9, L 5.1 (PP: 22 – 40; BOS 42 – 32). The poor Pears had a terrible week — their pitchers were above replacement (6.31 ERA) and their hitters were weak (3.7 rc/g). Anthony Rendon (.368, .455, .632) and McKenzie Gore (9 ip, 1 er) were the bright lights of hope.
Bellingham: W 2.9, L 3.1 (BC: 33 – 29; MIL: 21 – 18. ) The Brewers did slightly better than the Cascades, which is nothing to be ashamed of, as good as the Brewers are this season. Randy Arozarena led the team, going 9 for 19 with 3 homers and 6 walks for an awesome .474, .577, .954 slash line, worth 28.5 rc/g.
Pittsburgh: W 3.2, L 2.8 (PA: 17 – 25; COL 13 – 20.) The Alleghenys got some decent pitching, especially from Jose Berrios (7 scoreless innings), but their hitting was onlu a hair above replacement level. The Rockies helped out by playing poorly. This gave the A’s a strong dose of the MLB opposition drug, boosting their drug-dependence from a meager 0.012 to a worrisome 0.050.
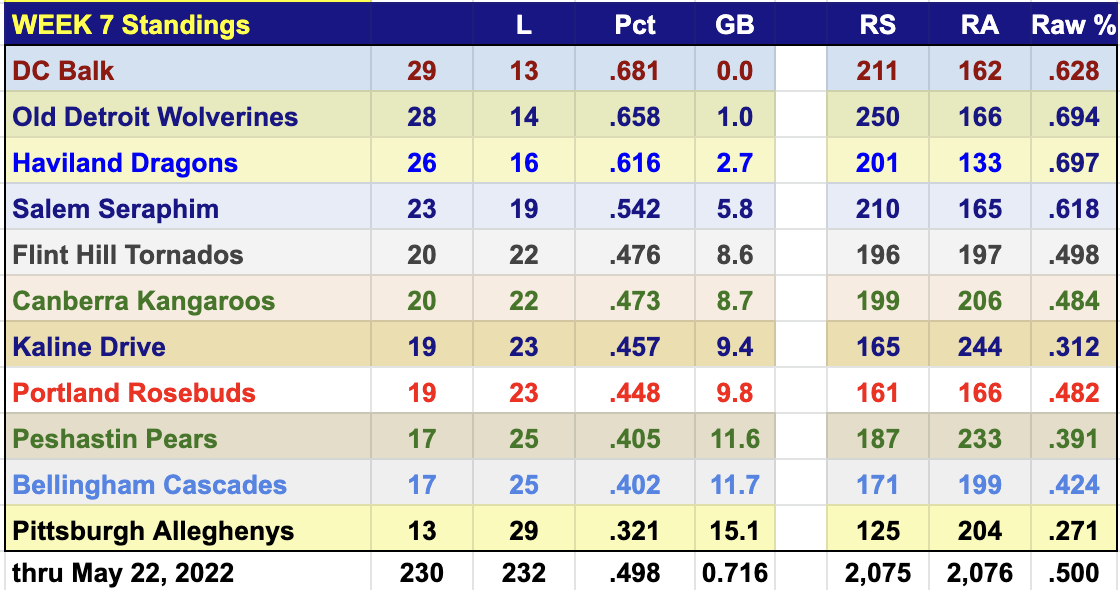
Poor Flint Hill. First, it mysteriously had it’s allocations change to leave Cueto out, and now they don’t get a write up to show how, even without Cueto’s 6 scoreless innings yesterday, they climbed to 5th place at the end of week 7.
Ron, do you have a record of how my allocations changed from Week 6 to Week 7? Maybe that will show what happened to Cueto? Maybe?
Jamie:
I just checked and
a) I either missed Cueto or overwrote his line so he had no stats showing, and
b) the allocation had him at 0 percent. If you changed that last week, I missed it. I have fixed both errors and your current standings should be correct.
If you didn’t change Cueto’s allocation last week, let me know this evening, because I would need to go back and zero out his week 7 allocations. Once I transfer Week 7 stats from the data entry sheet to the archive sheet — which I will do this evening or tomorrow morning — it gets a lot harder to fix errors.
Thanks! Yes, I should only get his most recent start, and not his first since we don’t have mid-week reallocation capabilities. I did check, and he was allocated 100% for Week 7, so we are good. Hopefully his magic won’t run out any time soon…
Also, I had to go back and REDO the correction because I called for all the results since May 16, but our week started May 17, so you got his 6 shutout innings from his start in Week 7 but not his other sterling innings from Week 6.
It did provide a nice experiment in the effects of good pitching. Adding 12 shutout innings moved you from 8.6 games back to 8.0. Taking away half those shutout innings dropped you back to 8.3 games back.